Is there real science behind Whoop Healthspan?
WHOOP Healthspan has just become available on the 4.0. Until now, only users with the 5.0 or MG had access. Now that the feature has expanded, it’s a good time to look past the graphs and scores and into how it actually works. The science behind the whole thing.
Why WHOOP Age exists
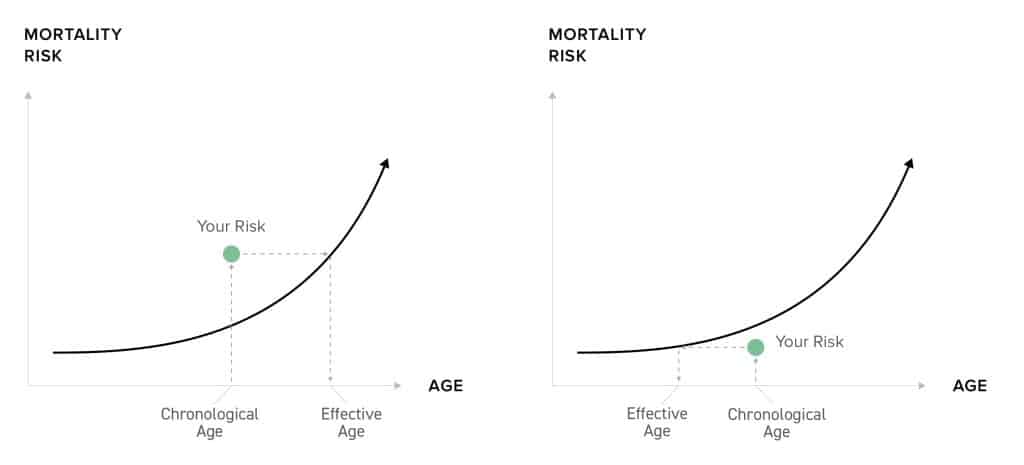
As detailed in our earlier coverage, WHOOP Age is based on something called effective age. Instead of counting how old you are, it estimates what age someone else would need to be to have the same all-cause mortality risk as you. So if your risk matches that of a typical 60-year-old, even though you’re 50, your WHOOP Age is 60. If it matches that of a healthy 40-year-old, your WHOOP Age is 40.
This risk is anchored in decades of research into all-cause mortality. WHOOP chose this particular outcome because it captures a wide range of health trajectories, including cardiovascular, metabolic and neurodegenerative diseases. It avoids focusing too narrowly on one risk area and instead tracks the overall decline in physiological resilience.
How mortality risk is converted into age
Now for the science lesson. Strap in.
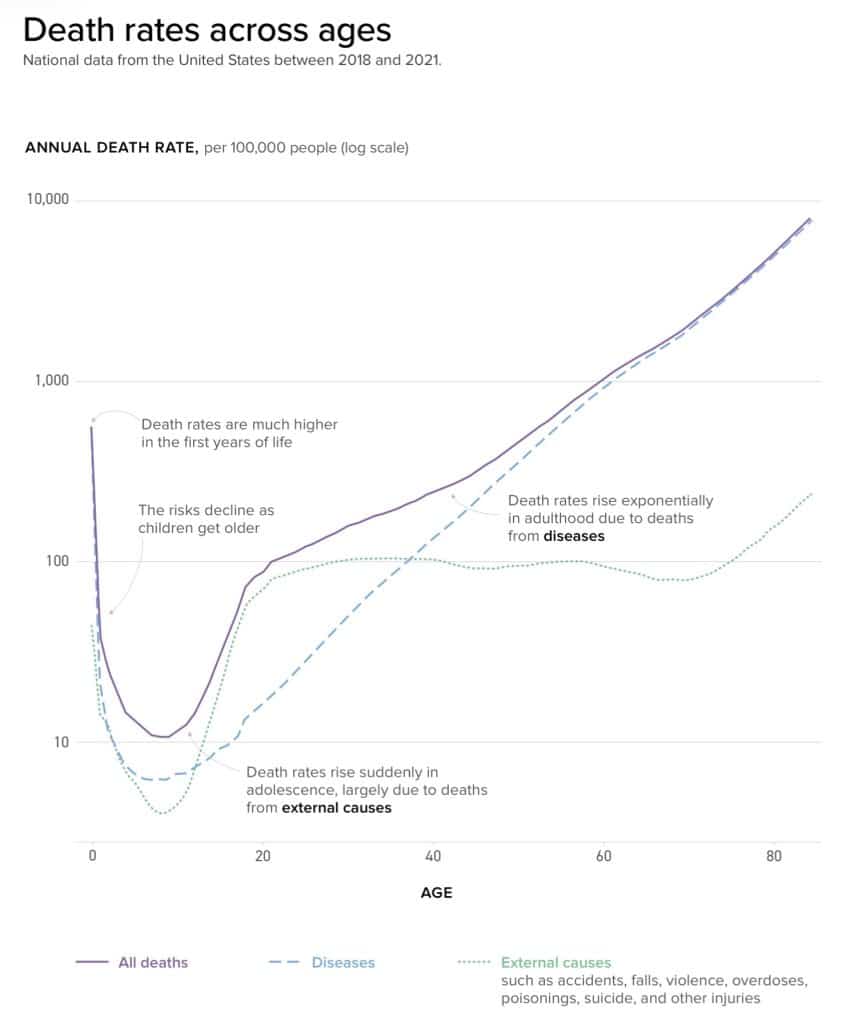
As detailed in the company’s White Paper, the engine behind the whole thing is something called the Gompertz Law. This is a demographic model that shows mortality risk increasing exponentially with age, doubling roughly every 8 to 10 years after your mid-20s. Once you know how a specific behaviour changes risk, you can calculate how many years of age would be needed to create the same shift.

WHOOP does this using hazard ratios. For each behaviour or physiological input, they consult the scientific literature to find high-quality studies that estimate its association with all-cause mortality. Sleep consistency, for example, has been linked to 20 to 48 percent reductions in mortality when kept above 70 percent. Regular strength training, even in modest amounts, cuts all-cause mortality by up to 30 percent. VO₂ Max improvements are tied to even larger benefits. Simple.

Once WHOOP estimates the hazard ratio for each input, they use a log-linear formula to convert that risk into age difference. A 10 percent increase in mortality risk corresponds to roughly one year of effective age. So a hazard ratio of 1.22 would push your WHOOP Age up by two years. A hazard ratio of 0.85 would lower it by about one and a half. The effect is cumulative. Each input adds or subtracts from the total.
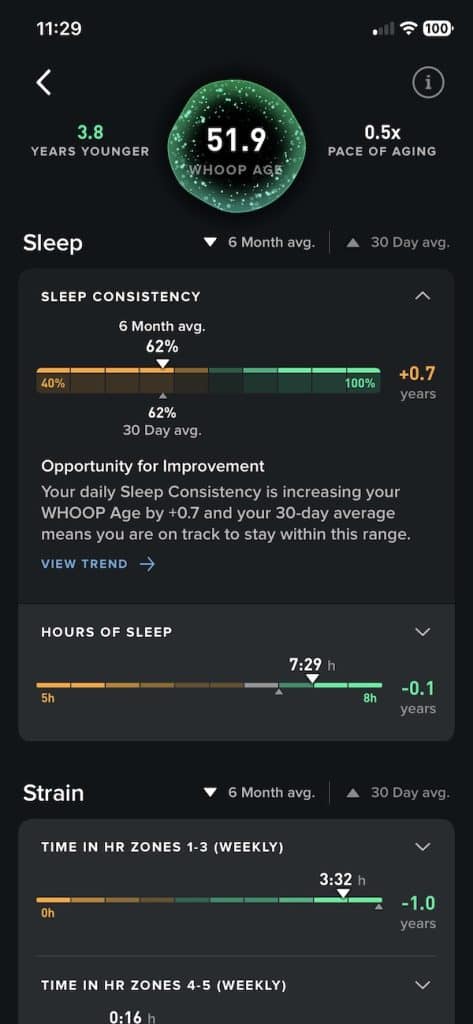
In fact, if you delve into the breakdown of the Healthspan metrics, the Whoop app will show you exactly how each factor is contributing to your overall estimate. For example, in my case my sleep consistency increased by Whoop Age my 0.7 years. While my time in HR zones 1-3 decreases it by about a year.

Dealing with correlated metrics
This would be simple if all metrics were independent. But they’re not. VO₂ Max and resting heart rate are tightly linked. So are daily steps and heart rate zone time. If you added up the hazard ratios without adjustment, you’d inflate the total effect.
To solve this, WHOOP built a structural equation model. They created a theoretical model of how the different components influence each other, then compared it to real-world WHOOP data from thousands of users. By comparing the actual covariance matrix to the expected one, they derived adjustment factors. These correct for overlap and ensure that each behaviour contributes proportionally, without double-counting. This step is what makes the system behave more like a real physiological model and less like a basic scoring system.
Choosing a meaningful reference point
Another critical decision is who you’re being compared to. WHOOP does not use average population data. That would mean your WHOOP Age could look great even if you’re just slightly healthier than the norm. And in countries where chronic conditions are common, that average is not a very high bar.
Instead, they created a health-optimized referent profile. This is based on clinical guidelines and expert consensus. For each input – sleep, fitness, steps, lean mass – they define a threshold that aligns with better long-term health outcomes. If you meet the target, that component contributes zero years to your WHOOP Age. But if you exceed it, it subtracts. If you fall short, it adds.
For example, VO₂ Max targets vary by age and sex. For a 30-year-old male, the goal is 44 ml/kg/min or higher. In the case of a 30-year-old female, it’s 38. Sleep duration should land between 7 and 9 hours. Daily steps are expected to exceed 8,000 for younger users and 5,600 for older adults. Lean body mass targets also vary but sit around 80 percent for men and 67 percent for women in early adulthood.
These are not population averages. Which means that if you are a 40 year old and Whoop estimates your Whoop Age to be 40 – you are in fact healthier than a typical 40 year old.
WHOOP Age and perceived health
To see if any of this holds up, WHOOP ran an internal observational study in early 2025. Thousands of users completed a health questionnaire through WHOOP Labs. They self-reported how healthy they felt, and whether they had chronic conditions. Then WHOOP compared those responses to each person’s WHOOP Age.
The results were encouraging. People who said their health was poor had a WHOOP Age nearly five years higher than their real age. Those who reported excellent health had a WHOOP Age nearly five years lower. Even among users with chronic conditions like diabetes, many had WHOOP Ages below their chronological age. This suggests that the metric responds more to lifestyle than to diagnosis alone. These users were still engaging in healthy behaviours, and the model captured that.
Understanding Pace of Aging
WHOOP Age is based on six months of data and moves slowly. Pace of Aging, on the other hand, looks at your most recent 30 days. It shows whether your habits are improving or eroding your trajectory. A score of 1.0 means your WHOOP Age is climbing at the same rate as your real age. Below 1.0 and you’re aging more slowly. If you dip below 0.0, the model predicts your WHOOP Age will go down over time. So that is what you want to aim for.
A research model in a consumer wrapper
Most wearables give you activity rings or readiness scores. Healthspan is trying something different. It pulls together published science, validated statistical frameworks, and actual user data to create a picture of long-term functional health. It’s not perfect. It doesn’t include diet or emotional stress. But it is rooted in models that public health researchers have used for years.
Now that it’s live on the 4.0, more people will be able to see how close their behaviour gets them to the physiological age they want. Whether or not they act on it is another story. But the science is there.
Don’t forget to check out our full review of Whoop.
Subscribe to our monthly newsletter! Check out our YouTube channel.
