
The no cost route to viewing your Garmin annual summary
As we approach 2026, it’s a great moment to reflect on the past year. For those with a Garmin watch, delving into your annual summary can be enlightening. How did you fare? The company has a new “Rundown” feature which lives behind the Connect+ paywall. But you don’t have to pay to get access to these types of stats.
Looking back at last year’s fitness data can tell you a lot about what worked and what didn’t. It’s a smart way to spot habits, track progress and set better goals going forward. With the New Year approaching, that kind of insight is more useful than ever.
And don’t forget – resolutions often fall apart by February! To avoid that, pick goals that line up with what your data shows. If consistency was an issue, aim for smaller wins. Focus on one metric like daily steps or resting heart rate, then build from there. Check in every month and let the numbers guide you.
Viewing summary stats in Garmin Connect
The Garmin Connect website is great and provides far more access to your data than the watch or the Connect smartphone app. It is also easier to navigate and find things.
A feature that is a little diffficult to find, however, is the past year summary. Similar to what is available with other brands, Garmin also provides this overview. But few people are aware of it.
After you’ve logged into the web dashboard, navigate to the Reports tab on the Garmin Connect website. At the bottom of the menu, you’ll see a Progress Summary option. It’s right at the bottom.
This opens up a new page where you can view an overview for the previous year, month, week, and previous years. Select a time period from the available options.

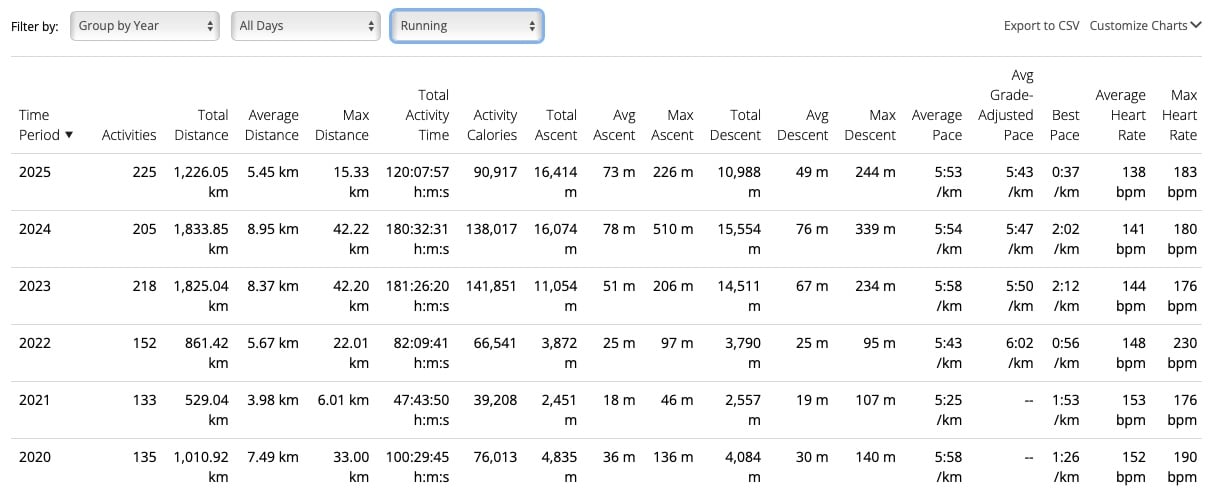
Then you’ll need to select how to group the data. There are time options, along with activity and event. A useful one is “Group by Year”. This provides an excellent overview of your long-term progress. .

There’s also the option to choose a specific activity. Most of the data that you get as a post-activity summary, appears in these tables. If you choose “All Activities” you’ll only get the headline stats.

The feature provides lots of data, allowing you to easily check your summary stats. Here’s a yearly overview of my running activity. Scroll left-right to navigate through the various statistics.
On the right-hand side of the page, you’ll find a “customize” drop down list. This allows you to select which data shows for a selected table. Next to this is a self-explanatory “Export to CSV” option.
We hope this information is useful to some readers who may have previously been unaware of this option. Check out your annual fitness stats as they will provide useful information about your physical activity and progress. And they will help to keep you motivated.
Don’t freak out, for example, if you notice your average resting heart rate slowly creeping up in the second half of the year – it might coincide with a busy work season or less workout time. Comparing the first half of the year to the second half can help you spot patterns, like a slump in your average weekly running mileage during winter months or a jump in steps when the weather got warmer. Little things like this give you an idea of where to focus your energy next year. It’s all about turning that big block of year-long data into relatable action steps.
What about steps, sleep and other data?
Diving into your exercise statistics is just the beginning. The great news is that Garmin Connect also allows you to view annual summaries of various health metrics, including steps, intensity minutes, average resting heart rate, stress levels, sleep duration, and more. The key is knowing where to find this treasure trove of data.
To access this comprehensive information, head back again to the Reports section. But instead of selecting Progress Summary, navigate to Health and Fitness. Here, a dropdown list presents various metrics for you to explore.
Let’s take steps as an example. Upon selecting this metric, a new screen appears, offering options to view daily, 7-day, 4-week, and 1-year totals. Opt for the yearly summary to get a broad view of your activity. If you’re curious about past years, simply use the calendar arrows to navigate backward.
When you look at your Garmin’s 12-month summary, you’re not just looking at stats- you’re basically getting the big-picture story of your entire year. Think of your average resting heart rate over that period as a window into how well you handled stress or recovered from workouts on a broad scale, rather than in isolated chunks. Your year-long step count can show how consistent (or not) you’ve been with daily movement, beyond the inevitable off-weeks or holidays.
So as you can see, there’s no need to pay extra to see your annual Garmin stats. But you do need to know where to look for them.
Seeing these numbers add up over a whole year is a reality check: it lets you see how small decisions, like taking the stairs more often, pile up into real changes over time. Armed with this data, you’re now ready to set ambitious yet attainable goals for 2026 and see them through!
Subscribe to our monthly newsletter! Check out our YouTube channel.
And of course, you can follow Gadgets & Wearables on Google News and add us as a preferred source to get our expert news, reviews, and opinion in your feeds.
Awesome….thanks a lot!!
I thought that Garmin send out and email last year to sum up your activities. But this trick is even better!